
This article has been inspired by
Times Tables, Mandelbrot and the Heart of Mathematics by MATHLOGER
and
LightsRaysReflections by mathematician Simon Plouffe
Algorithm :
Draw a cricle. Take a number n (for the sake of our explanation more than four at least), and put n points on the perimeter of the circle equally spaced. Then, lable the points from 0 to n and put the nth point back
on the point labelled zero since nmodn is zero. Now, let's consider 2's times table as an example, till nth number. So, we first mutiply 2 with 1, and connect the point labelled one to the point labelled two using a straight line. Then, we
do the same for 2x2, and connect the point labelled 2 to the point labelled 4. After that, we again multiply 2 with 3, and connect the point labelled 3 to the point labelled 6. Similarly, we continue mutiplying 2 with numbers from 4 to n,
and connect the point labelled with the number we are multiplying 2 with to the point labelled with the product of 2 and the other respective number, and if the product is greater than the number n, then we simply take the modn of the product
and connect the point multiplying two with to the point labelled with the result of product (of 2 and some number) modn. This way, we get an aesthetic looking circle with n lines inside, bridging points on the perimeter of the circle.
The shape we obtain for the times table of 2 has a special place in Mathematics, and people call it the cardioid. It appears in a lot of places in maths, and needless to say, its a feast for the eyes. Similarly, if we follow the same
algorithm for three, a very distinct shape materializes as well, and we call it the nephroid. Both nephroid and cardioid appears in Manelbrot Set, and suprisingly on your cofee as well, only if you choose to put the light falling on your coffee
at a definitive angle. To know more about these shapes you can visit the links here -
LightsRaysReflections by mathematician Simon Plouffe
,
Times Tables, Mandelbrot and the Heart of Mathematics by MATHLOGER
. Similarly, if you follow the algorithm for different values of n and times-table of different numbers (from one to n), you'll end up awakening the artisit inside you. Give it a try mate!. If you want you can use the link given below
for using our program in p5.js to visualize the stunning shapes, and ultimately fall in love with Algorithms.
The following animation in p5.js shows visualization of Times Table from one to 200 for different values of factor (which was two in our example above)
Try visualizing different shapes for your own desired values of factor using this link (pro tip: YOU WONT REGRET)
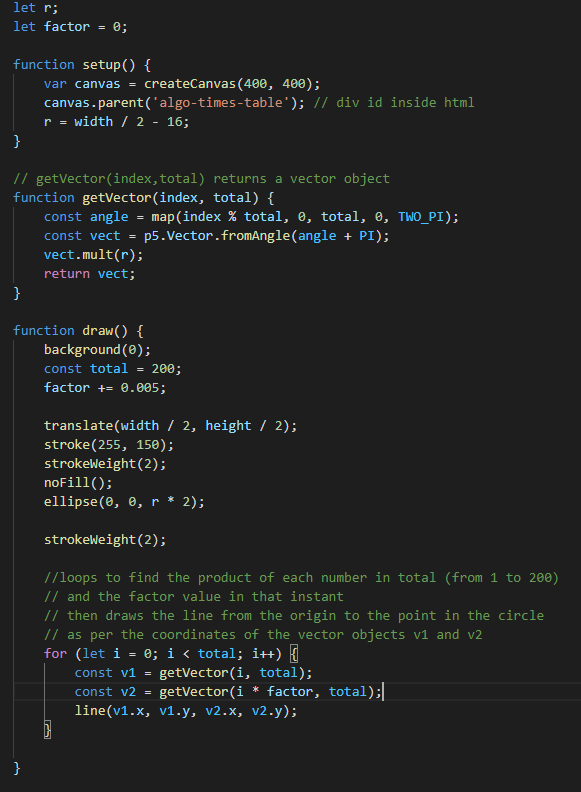
The following are some times table visualizations drawn with some values of factor, with total being 200:
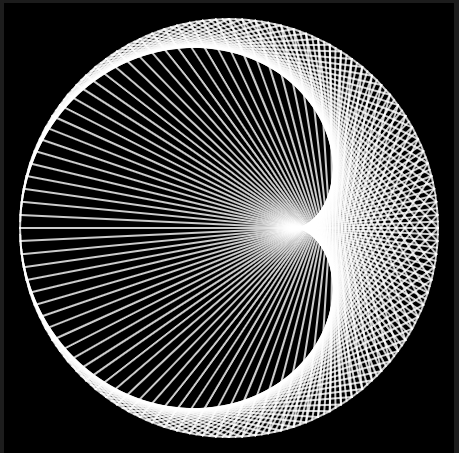
factor = 2
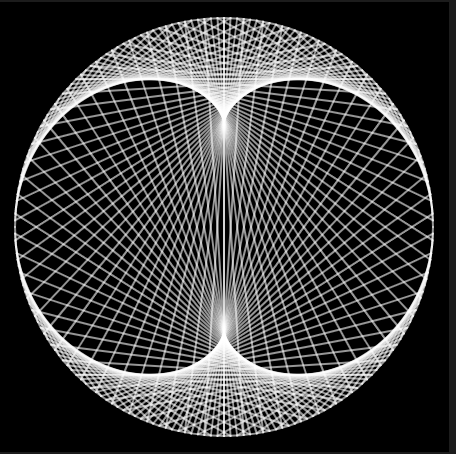
factor = 3
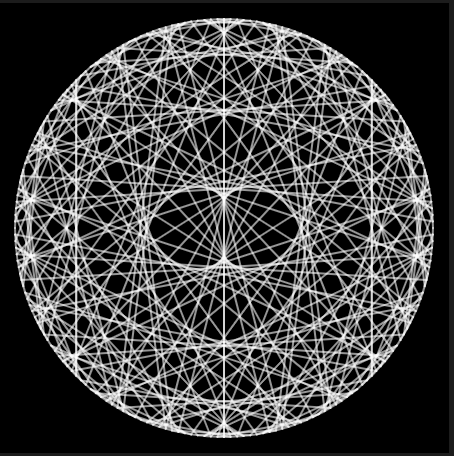
factor = 23
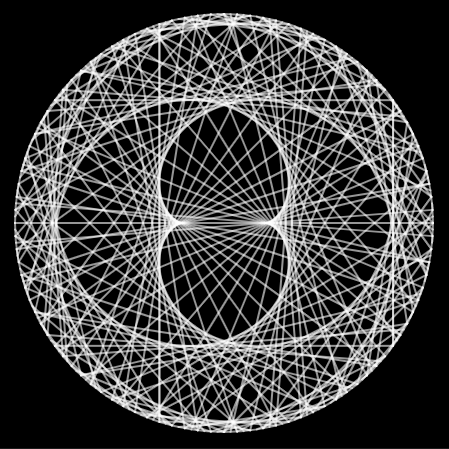
factor = 34
To know more :
https://youtu.be/bl3nc_a1nvs
https://en.wikipedia.org/wiki/Cardioid
https://youtu.be/6z7GQewK-Ks